Monday's Trade Analysis:
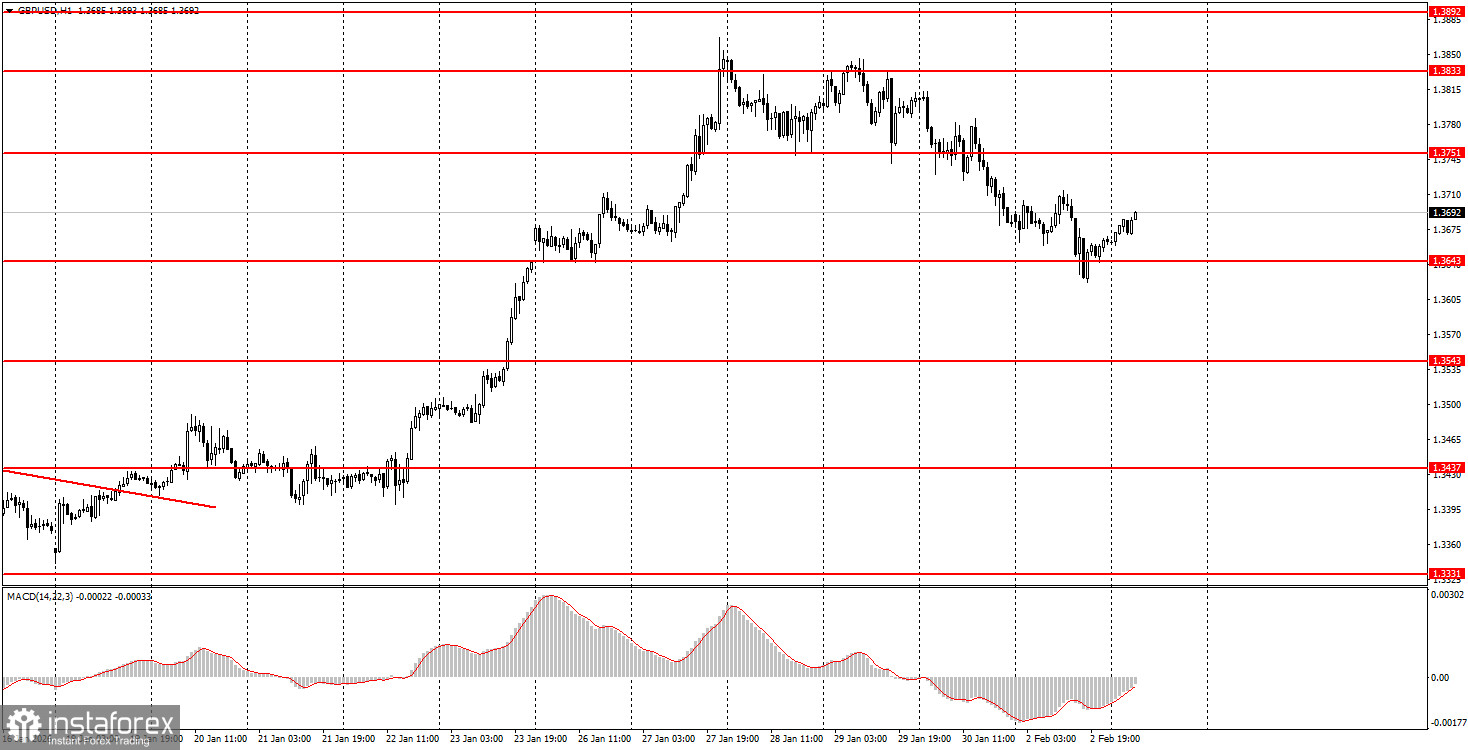
1H Chart of the GBP/USD Pair
The GBP/USD pair continued its downward movement throughout Monday, largely driven by the ISM Manufacturing Index for the US. This index showed a very high value relative to forecasts and the previous month's figure, which inevitably triggered a market reaction. In general, the US dollar has been rising for several days, but even on the hourly timeframe, it is evident that this is a correction. It cannot be said that the fundamental background has improved for the US currency in recent days. On Sunday, a new wave of protests against Donald Trump swept across America. This event is somewhat indirectly related to the currency market, but it still holds significance. Another scandal involving Trump is brewing in the US, though this time it involves more than just him. This week, a plethora of important reports will be published in the US, and the Bank of England will hold a meeting. It is guaranteed to be an interesting week.
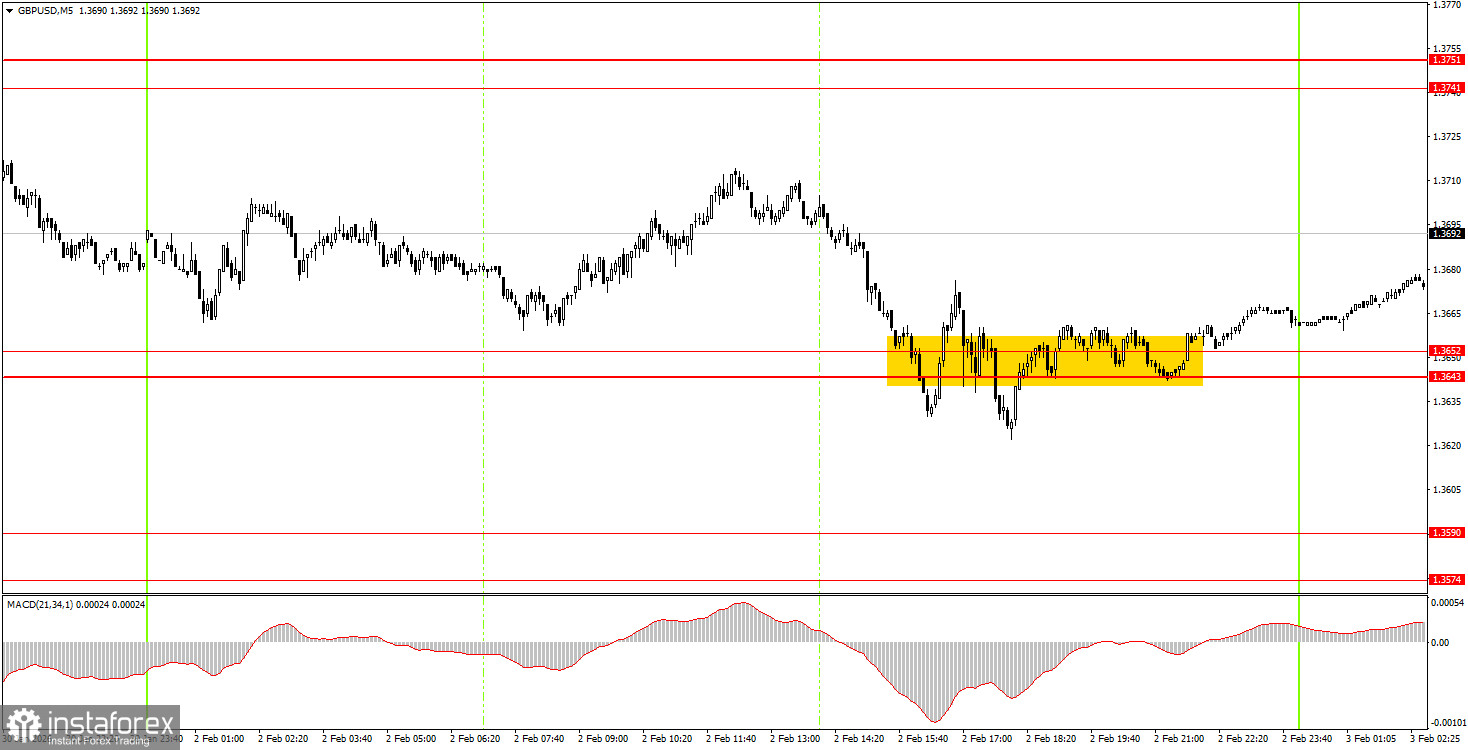
5M Chart of the GBP/USD Pair
On the 5-minute timeframe, several trading signals were formed on Monday, but all of them turned out to be false. As soon as the price reached the area of 1.3643-1.3652 (which had previously provided clear support or resistance), volatility ensued. The price jumped back and forth, making it impossible to secure profits based on the formed signals. It was not the most successful trading day, but such occurrences happen in the market.
How to Trade on Tuesday:
On the hourly timeframe, the GBP/USD pair continues to correct, but it seems that this correction will not last long. No global factors are driving medium-term dollar growth, so we expect the global upward trend from 2025 to continue, which may push the pair to 1.4000 in the near future. Donald Trump's policies continue to impede the strengthening of the American currency, and the current events in the US may put additional pressure on the dollar.
On Tuesday, beginner traders may consider opening short positions if the pair consolidates below the 1.3643-1.3652 area, targeting 1.3574-1.3590. A rebound from the area of 1.3643-1.3652 will allow for the opening of long positions with a target of 1.3741-1.3751.
On the 5-minute timeframe, levels to trade can include: 1.3319-1.3331, 1.3365, 1.3403-1.3407, 1.3437-1.3446, 1.3484-1.3489, 1.3529-1.3543, 1.3574-1.3590, 1.3643-1.3652, 1.3741-1.3751, 1.3814-1.3832, 1.3891-1.3912, 1.3975. There are no interesting events planned in the UK for Tuesday, while in the US, the JOLTs report on job openings will be released. Overall, calm market movements are expected today unless Trump makes another surprise announcement.
Main Rules of the Trading System:
- The strength of the signal is determined by the time it took to form the signal (rebound or breaking through the level). The shorter the time, the stronger the signal.
- If two or more trades were opened around a particular level based on false signals, all subsequent signals from that level should be ignored.
- In a flat market, any pair can generate numerous false signals or no signals at all. In any case, it is best to stop trading at the first signs of a flat.
- Trades are opened during the time period between the start of the European session and until the middle of the American session, after which all trades should be manually closed.
- On the hourly timeframe, signals from the MACD indicator should ideally be traded only when there is good volatility and a trend confirmed by a trend line or channel.
- If two levels are too close to each other (ranging from 5 to 20 pips), they should be considered as a support or resistance area.
- After moving 20 pips in the correct direction, it is advisable to set the Stop Loss to break-even.
What's on the Charts:
- Support and resistance levels are targets for opening buy or sell trades. Take Profit levels can be placed around them.
- Red lines indicate channels or trend lines that reflect the current trend and indicate the preferred direction for trading now.
- The MACD indicator (14,22,3) – the histogram and signal line – serves as a supplementary indicator that can also be used as a source of signals.
- Important speeches and reports (always found in the news calendar) can significantly influence the movement of the currency pair. Therefore, during their release, trading should be conducted with maximum caution, or it is advised to exit the market to avoid a sharp price reversal against the preceding movement.
- Beginners trading in the Forex market should remember that not every trade can be profitable. Developing a clear strategy and practicing sound money management are the keys to long-term trading success.